简体中文
繁體中文
English
Pусский
日本語
ภาษาไทย
Tiếng Việt
Bahasa Indonesia
Español
हिन्दी
Filippiiniläinen
Français
Deutsch
Português
Türkçe
한국어
العربية
S&P 500 Reversal Forming, Nikkei 225 Gains with Docomo Price Cuts

요약:Equities traded little higher as the Nikkei 225 rose with NTT Docomo shares after smaller-than-expected price cuts. All the while, the S&P 500 is carving out a bearish technical pattern.
Asia Pacific Markets Wrap Talking Points
Nikkei 225 supported by gains in NTT Docomo
Equities facing European sentiment, US data
S&P 500 carving out bearish reversal pattern
Find out what retail traders equities buy and sell decisions say about the coming price trend!
Asia Pacific equities generally traded higher in a rather choppy session. On Wall Street, the S&P 500 ended the day close to little changed following a mixed start to the early phases of the US earnings season.
Japans benchmark Nikkei 225 was supported by wireless telecommunication services as NTT Docomo soared. The company announced smaller-than-expected price cuts as the stock rose about 3.4%, its best performance in a single day since December.
There was a temporary surge of risk aversion around the time of the RBA minutes from the April policy meeting. As anticipated in this weeks fundamental forecast, AUD/USD weakened and remained lower despite equities resuming their upside push. The anti-risk Japanese Yen underperformed.
Ahead, the equity outlook is vulnerable to disappointing economic sentiment surveys out of Europe. Another risk may come from softer-than-expected US industrial production. Lately, data out of the worlds largest economy has been tending to underperform. More of the same may add fundamental pressures to the S&P.
S&P 500 Technical Analysis
Taking a look at S&P 500 futures, in order to see afterhours trade, the index is carving out a falling wedge bearish pattern on the daily chart. This is accompanied with negative RSI divergence which shows that upside momentum is fading after resistance was cleared at 2900. As such, technical considerations err on the side of caution as the floor of the candlestick pattern may be tested soon.
{12}
S&P 500 Daily Chart
{12}
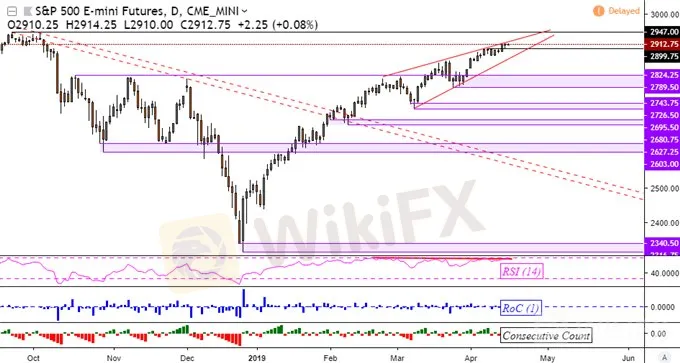
Chart Created in TradingView
면책 성명:
본 기사의 견해는 저자의 개인적 견해일 뿐이며 본 플랫폼은 투자 권고를 하지 않습니다. 본 플랫폼은 기사 내 정보의 정확성, 완전성, 적시성을 보장하지 않으며, 개인의 기사 내 정보에 의한 손실에 대해 책임을 지지 않습니다.
WikiFX 브로커
환율 계산기

