简体中文
繁體中文
English
Pусский
日本語
ภาษาไทย
Tiếng Việt
Bahasa Indonesia
Español
हिन्दी
Filippiiniläinen
Français
Deutsch
Português
Türkçe
한국어
العربية
Gold Breaks Above $3400 as Stocks Hit New Highs
Sommario:Over the past two weeks, both safe-haven and risk assets have risen in tandem—a pattern that has emerged as a new market dynamic since 2020, contrasting sharply with the logic of the previous decade.
Over the past two weeks, both safe-haven and risk assets have risen in tandem—a pattern that has emerged as a new market dynamic since 2020, contrasting sharply with the logic of the previous decade. A key takeaway from recent movement is that gold‘s rally is once again moving in step with non-USD currencies, reinforcing the importance of the U.S. Dollar Index (DXY) in forecasting gold’s next move.
Yesterday, the DXY slid from a high of 98.21 to a low of 97.78. EUR/USD broke above the 1.17 level, while USD/JPY dropped below 148. If we separate risk assets from gold and non-USD currencies, its evident that the U.S. stock market is currently experiencing a FOMO-driven rally. Recent reports from the FMS Fund Manager Survey show that fund managers are actively increasing allocations to U.S. assets, further supported by strong Q2 earnings results. With no compelling reason to sell, U.S. equities are staying buoyant.
Despite the calm market environment, the dollar saw a notable pullback, which we interpret as a technical correction rather than the beginning of a downtrend. We view the DXYs current movement as bottoming, not as a signal of continued bearish momentum.
Commodities Under Pressure
Crude oil prices have been trending lower. We expect the market to soon pivot toward concerns about weakening end-user demand and rising recession risks. The seasonal “summer driving season” demand for oil has failed to materialize, and OPEC+ is preparing for another production hike. According to Bloomberg, the final phase of the planned 550,000 barrels per day increase is set for completion in September.
The International Energy Agency (IEA) reports that global oil inventories are currently rising by 1 million barrels per day, with a 1.5% supply surplus expected in Q4.
However, the UAE‘s energy minister stated during a meeting in Vienna that despite several months of increased output, there hasn’t been a significant inventory buildup, indicating that the market still needs the additional supply.
For Middle Eastern producers, the cost of production is as low as $6 per barrel. From their perspective, OPEC+ still has room for further hikes in October, and protecting oil prices may not be a strategic priority.

Figure 1: WTI Crude Futures PriceSource: CNBC

Figure 2: U.S. Shale Oil Production Remains ElevatedSource: MacroMicro
Impact on Inflation and the Dollar
Falling commodity prices will weigh on inflation. If end-user demand indeed weakens in H2, even a rate-cut cycle might not provide relief. As seen in 2022, safe-haven capital could flow back into the dollar, sparking a broad-based correction across all asset classes—except the greenback.
We believe this disruptive environment could persist for a full quarter or longer. Our stance on gold remains unchanged: short-term outlook has shifted from bearish to neutral, while the medium-term view remains cautious, largely hinging on the DXYs trajectory.
Gold Technical Analysis
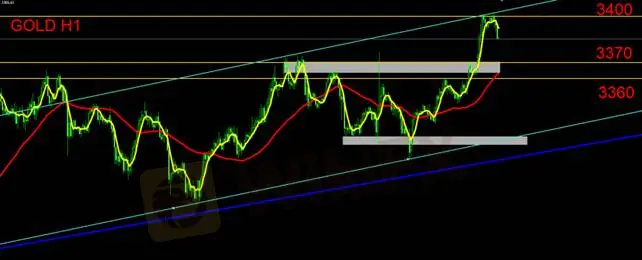
On the hourly chart, gold has formed a two-leg rally and is currently trading within an ascending channel. Now that price has broken above the $3400 resistance and touched the upper channel boundary, a near-term pullback is likely. Immediate support levels lie at $3370 and $3360. Failure to hold these could see prices return to the lower channel boundary.
Intraday Strategy:
If price retests the $3404 region and fails to break higher, short-term short positions targeting the lower end of the channel could be favored. Overall, given the current structure, short setups appear more advantageous than long ones.
Support Levels: $3370 / $3360
Resistance Level: $3400
Risk Disclaimer:
The views, analysis, research, prices, or other information presented here are intended solely for general market commentary and do not represent the official stance of this platform. Readers should independently assess all risks. Trade with caution.
Disclaimer:
Le opinioni di questo articolo rappresentano solo le opinioni personali dell’autore e non costituiscono consulenza in materia di investimenti per questa piattaforma. La piattaforma non garantisce l’accuratezza, la completezza e la tempestività delle informazioni relative all’articolo, né è responsabile delle perdite causate dall’uso o dall’affidamento delle informazioni relative all’articolo.
WikiFX Trader
ATFX
Doo Prime
FOREX.com
Exness
GTCFX
IB
ATFX
Doo Prime
FOREX.com
Exness
GTCFX
IB
WikiFX Trader
ATFX
Doo Prime
FOREX.com
Exness
GTCFX
IB
ATFX
Doo Prime
FOREX.com
Exness
GTCFX
IB
Rate Calc

