简体中文
繁體中文
English
Pусский
日本語
ภาษาไทย
Tiếng Việt
Bahasa Indonesia
Español
हिन्दी
Filippiiniläinen
Français
Deutsch
Português
Türkçe
한국어
العربية
Gold Hovers Around 3350 Ahead of Key ECB Outlook
Sommario:Weekly CommentaryAs we highlighted in last weeks analysis, our stance on gold has shifted from bearish to neutral, primarily due to its decoupling from macroeconomic data—a phenomenon largely driven b
Weekly Commentary
As we highlighted in last weeks analysis, our stance on gold has shifted from bearish to neutral, primarily due to its decoupling from macroeconomic data—a phenomenon largely driven by the “Trump Tariff Effect.”
Despite a broadly negative macro backdrop, risk assets climbed steadily throughout Q2 and early Q3, even setting new all-time highs. Weve cautioned investors that risk assets appear overextended, with current valuations reflecting an irrational chase higher.
Notably, gold has not seen capital outflows back into risk assets despite rising risk appetite. Even with the dollar rebounding from its lows, gold prices remained resilient. Given the current lack of clear correlation, we recommend investors shift their focus to non-USD currencies rather than over-analyzing golds movement in isolation.
ECB Policy Meeting in Focus
This Thursday, the European Central Bank will hold its policy meeting. Markets expect forward guidance not only on the broader economic implications of tariffs but also on how reciprocal tariffs could influence inflation. A key question remains: Are these price shocks one-off or permanent?
Long-Term Perspective: U.S. Trade Shifts Since 2018
Since 2018, the share of U.S. imports from China has dropped from 21.69% to just 12.22% as of May 2025, marking a clear path of U.S. “decoupling” from China.
However, China‘s lost market share was absorbed by other trade partners. By 2020, the EU’s share increased from 18.70% to 20.46%, Canada from 12.72% to 13.02%, and Mexico from 13.38% to 14.55%. In contrast, Chinas export share to the U.S. fell sharply to 17.01%.
")
(See Chart 1: U.S. Import Share by Country – Source: M Square)
As the U.S. pivots away from China, its massive domestic demand provides opportunities for other countries to gain market share. Pro-U.S. nations have become the biggest beneficiaries. Today, Mexico and South Korea have hit record-high export volumes to the U.S., while Chinas figures have slumped to post-pandemic lows.
")
(See Chart 2: U.S. Import Value by Country – Source: M Square)
Reciprocal Tariffs: Current Overview
U.S. tariffs on Chinese goods: 51.14%
U.S. tariffs on non-China countries: 11.75%
Chinas tariffs on U.S. goods: 32.60%
Chinas tariffs on non-U.S. countries: 6.53%
")
(See Chart 3: Reciprocal Tariff Rates – Source: M Square)
Tariffs have significantly weakened Chinas price competitiveness. For example, a pencil from China priced at $1.00 faces a 50% tariff, raising the final cost to $1.50. Meanwhile, a Japanese pencil with a 25% tariff ends up at $1.25. For price-sensitive consumers with no brand loyalty, the choice is obvious.
Strategic Outlook
Investors should take a longer-term, macro-focused view rather than being swayed by short-term headlines. Understanding global dynamics is key to navigating the current productivity cycle. Otherwise, one risks losing clarity in volatile news-driven markets.
Technical Outlook on Gold
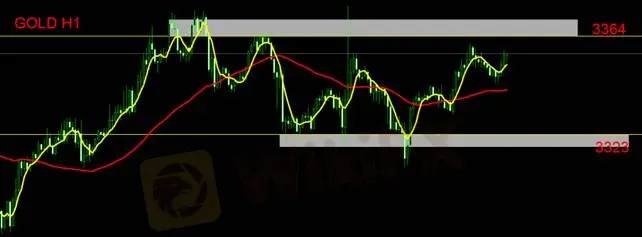
Gold is currently moving sideways without a strong directional trend. We advise investors to remain on the sidelines for now. Alternatively, intraday traders can monitor the 3364 resistance level—any breakout followed by a reversal candle may signal a false breakout. Likewise, a drop below 3323 followed by a bullish reversal pattern could be considered a false breakdown.
Support: 3323
Resistance: 3364
Risk Disclaimer:
The above analysis, opinions, research, and price projections are intended for general market commentary only and do not constitute investment advice. All readers assume full responsibility for their trading decisions.
Disclaimer:
Le opinioni di questo articolo rappresentano solo le opinioni personali dell’autore e non costituiscono consulenza in materia di investimenti per questa piattaforma. La piattaforma non garantisce l’accuratezza, la completezza e la tempestività delle informazioni relative all’articolo, né è responsabile delle perdite causate dall’uso o dall’affidamento delle informazioni relative all’articolo.
WikiFX Trader
FOREX.com
AvaTrade
IB
BG SAXO
EC Markets
IC Markets Global
FOREX.com
AvaTrade
IB
BG SAXO
EC Markets
IC Markets Global
WikiFX Trader
FOREX.com
AvaTrade
IB
BG SAXO
EC Markets
IC Markets Global
FOREX.com
AvaTrade
IB
BG SAXO
EC Markets
IC Markets Global
Rate Calc

