简体中文
繁體中文
English
Pусский
日本語
ภาษาไทย
Tiếng Việt
Bahasa Indonesia
Español
हिन्दी
Filippiiniläinen
Français
Deutsch
Português
Türkçe
한국어
العربية
Gold Price Chart Posts Bullish "Golden Cross" Formation, Will it Rally?

abstrak:Gold Price Chart Posts Bullish "Golden Cross" Formation, Will it Rally?

Gold posted a bullish “golden cross” formation this week that could suggest further gains are ahead
Gold bulls will need to avoid further taper talk that could spark a USD rally and cripple gold gains
Gold prices may continue to rise after the precious metal posted a bullish moving average crossover on the daily chart early this week. The “golden cross” formation occurs when a shorter-term moving average overtakes a longer-term moving average and many traders take the crossover as a hint that further gains could be in store. In the case of the gold price chart, the 50-day simple moving average has overtaken the 200-day simple moving average around the $1828 price point and may equip gold with the bullish sentiment required to push higher.
GOLD (XAU/USD) PRICE CHART: DAILY TIME FRAME (JULY 2020 - JUNE 2021)
That said, there are hurdles to be negotiated and an early barrier could be found near the $1920 level which roughly coincides with the metals swing high in 2011. I discuss the merits of the level and potential secondary resistance with Guy Adami and Dan Nathan, hosts of the MacroSetup, in the attached video.
GOLD (XAU/USD) PRICE CHART: WEEKLY TIME FRAME (MARCH 2010 - JUNE 2021)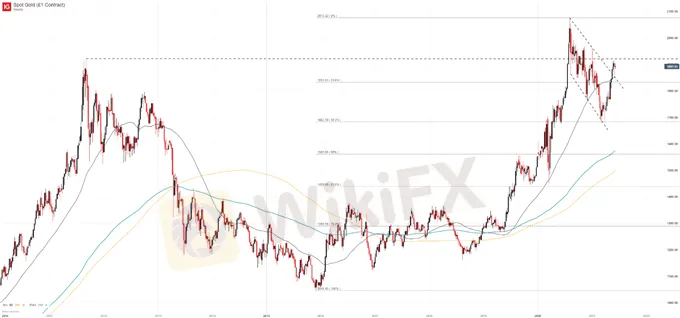
In addition to secondary resistance, updated economic projections and commentary from next weeks Federal Open Market Committee meeting could upend the fundamental landscape that has allowed gold to track higher. Sustained directionless movement in US Treasury yields, as the market has witnessed over the last few weeks, has likely contributed to the continuation higher for gold and a shift in tone from the Fed could put an end to the sideways price action. While the fundamental landscape and market sentiment could shift at any time, the technical outlook of XAU/USD is encouraging in my opinion.
Should market sentiment shift or the Fed change its policy path, early support likely resides along the upper-bound of the descending channel and around the $1,850 mark. Either way, gold remains in the midst of a bullish breakout from its August downtrend and the recent golden cross formation could suggest longer-term strength is on the horizon.


Disclaimer:
Ang mga pananaw sa artikulong ito ay kumakatawan lamang sa mga personal na pananaw ng may-akda at hindi bumubuo ng payo sa pamumuhunan para sa platform na ito. Ang platform na ito ay hindi ginagarantiyahan ang kawastuhan, pagkakumpleto at pagiging maagap na impormasyon ng artikulo, o mananagot din para sa anumang pagkawala na sanhi ng paggamit o pag-asa ng impormasyon ng artikulo.
Broker ng WikiFX
Exchange Rate

