简体中文
繁體中文
English
Pусский
日本語
ภาษาไทย
Tiếng Việt
Bahasa Indonesia
Español
हिन्दी
Filippiiniläinen
Français
Deutsch
Português
Türkçe
한국어
العربية
Seeing The Forest For The Trees - Week 22 | Technical Analysis by Jasper Lawler
Abstract:Weekly Thoughts Every day, there are opportunities to buy and sell in the markets. You can count the pips between market highs and lows and dream of the windfalls they could have bestowed on you.But j
Weekly Thoughts
Every day, there are opportunities to buy and sell in the markets. You can count the pips between market highs and lows and dream of the windfalls they could have bestowed on you.
But just because the market has moved doesnt mean you could—or should—have traded it.
For the most part, what we as traders do is ‘directional trading’:
choosing a direction for the market and
trying to time it.
You must have a consistent method for both.
We use longer-term weekly charts as our ‘edge’ to form a market view (bullish, bearish, or neutral), and shorter-term charts—usually daily—to decide when to get in and out.
This same idea applies to day traders using 1-hour charts for entries and daily charts for a broader view.
Long-term charts help us “see the forest for the trees”—that is, to understand the big picture rather than getting lost in the details.
Some traders simply plot a 200-day moving average on their daily chart and go long above it, short below it. There‘s a beauty to that simplicity, but we don’t do it.
Why?
Let‘s look at this week’s charts for a demonstration.
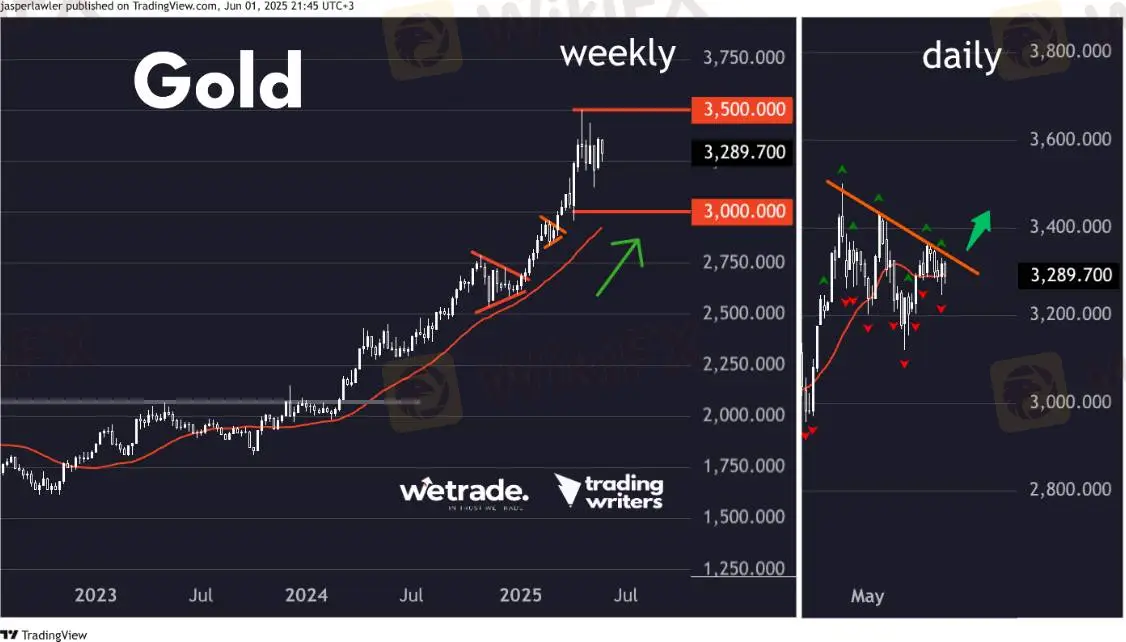
Gold just made a hyperbolic move, hit a record high at $3500 per oz, then spent 5 weeks chopping sideways. Its digesting those gains.
If you're still trying to buy dips or trade breakouts just because the price is above the 200 DMA, you'll get chopped up.
Yes, staying above the 200-day average shows overall bullishness, but the phase has changed. It‘s no longer trending fast; short-term, it’s going sideways. So you either trade mean reversion, or, as a trend follower, you wait.
Of course, it‘s easy to say 3500 was a near-term top in hindsight. You can’t see it right away. The trick is to keep observing the big picture and ask if anythings changed.
This week, were looking for signs the gold uptrend is resuming—but the choppy action may continue.
The US dollar tells a similar story, both against the yen (USD/JPY) and Swiss franc (USD/CHF).
Following the news can make forming a dollar view difficult. One day, Trump‘s tariffs go up, the next day they’re down, then a court ruling stops them, then an appeal reverses it! Add in ‘de-dollarisation’ and the ‘sell the US’ trend, and its noisy.
Sometimes—like USD/CHF—it‘s as simple as being bearish below a level and neutral above. While it’s below, we look for short setups. For USD/JPY, we see a long-term bearish chart pattern and are waiting to see if it completes. We can either go short now or wait.
Starting with weekly charts for the big picture and daily charts for timing creates a more robust approach than relying solely on one indicator like the 200-day MA.
Most importantly, it lets you trade with confidence, knowing youre in tune with the market.
Setups & Signals
We look at hundreds of charts each week and present you with three of our favourite setups and signals.
Gold (XAU/USD)
Setup
We are bullish on gold while it maintains its long-term uptrend. Having soared from 3,000 to 3,500 in just 3 weeks, the price has now been consolidating for the last month. We are looking for opportunities to trade the resumption of the uptrend.
Signal
A downtrend line connecting the last 3 peaks on the daily chart offers a possible breakout trade should the price close above it on a daily basis to target a new record high.
USD/JPY
Setup
Dollar-yen is carving out what could be a long-term Head & Shoulders pattern with a neckline at 140. Otherwise, the price action is range-bound with a flat 30-week moving average.
Signal
A ‘mini’ Head & Shoulders pattern might be forming on the daily chart with a neckline at 142. This follows a sharp rally from 142 to over 148 followed by a 100% reversal. A break could target the major long-term support at 140 and perhaps lower.

USD/CHF
Setup
The Dollar-Swissie weekly chart is one of the cleanest examples of US dollar weakness after the pair broke below the bottom of the long-term 0.84-0.92 range. We are bearish whilst the pair is below 0.84.
Signal
Similarly to USD/JPY, this pair has formed a short-term potential H&S pattern with 0.82 as the neckline and the left and right shoulders at 0.835. A break of the neckline could bring about a retest of the 0.80 round figure.

As always—thats just how our team sees it. What do you think?
Share your thoughts—or send us a request!
Disclaimer:
The views in this article only represent the author's personal views, and do not constitute investment advice on this platform. This platform does not guarantee the accuracy, completeness and timeliness of the information in the article, and will not be liable for any loss caused by the use of or reliance on the information in the article.
WikiFX Broker
Latest News
eToro Review 2025: Top Trading Opportunities or Hidden Risks?
 WikiFX
How much money will you earn by investing in Vantage Broker?
WikiFXIronFX vs Exness Review 2025: Comprehensive Broker Comparison
WikiFXFraudsters Are Targeting Interactive Brokers' Users with Lookalike Emails
WikiFXInteractive Brokers: Global Office Visits and Licensing Details
WikiFXEverything you need to know about ADSS
WikiFXTop Tips to Choose the Best Forex Broker in 2025
WikiFXSEBI Notifies New F&O Rules for Investors - New Derivative Trading Limits & More Amendments
WikiFXBaFin Issues Multiple Warnings Against Unlicensed Financial Services and Identity Fraud
WikiFXHe Thought It Was an Investment, Now RM900,000 Is Gone
WikiFXCurrency Calculator

